Hello,
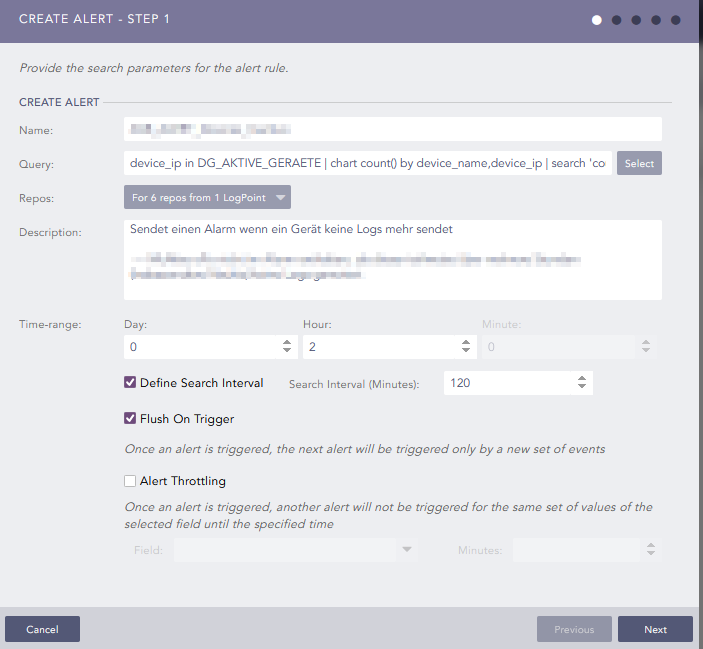
to get noticed when a device is no longer sending logs i created an alert that uses this search query:
device_ip in DG_AKTIVE_GERAETE | chart count() by device_name,device_ip | search 'count()' = 0
(AKTIVE_GERAETE is a device group i put all the devices in that should be monitored).
The alert runs every two hours and nearly every day at the same time (1am) i get an alarm per email that one of our firewalls didn’t send logs. I am pretty sure that is a false positive.
However, when clicking of the link in the email, i indeed see a hit.

But when searching again by clicking on search, there isn’t a hit anymore.

Displaying all logs from this device for the last 24 hours also does not show any missing logs for this time

So, as i said, pretty sure it is a false positive.
The alert is always triggered for the same device and always for the same timeframe (23pm and 1am), so i was thinking that the LP wants me to somehow acknowledge it before stopping to trigger it. But i already marked and closed all incidents of the alarm at one point, but the next day the alarm was triggered again.
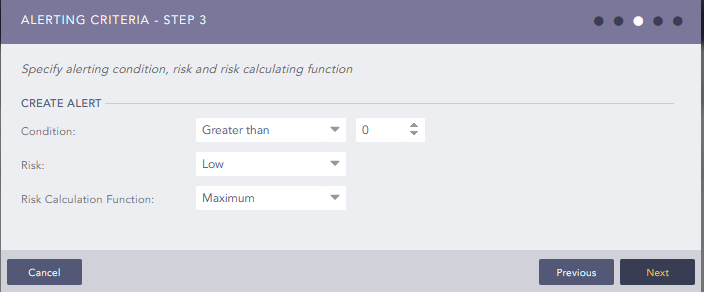
Here is the configuration of the alert:


Anybody got any ideas ? Am i missing something ? I know the next LP version will have the detection of inactive device “build in”, but i am curious what is going on here.
Andre