Dear fellow LogPoint users,
I am wondering if there is the possibility to compare the results of a querry for different times in one plot?
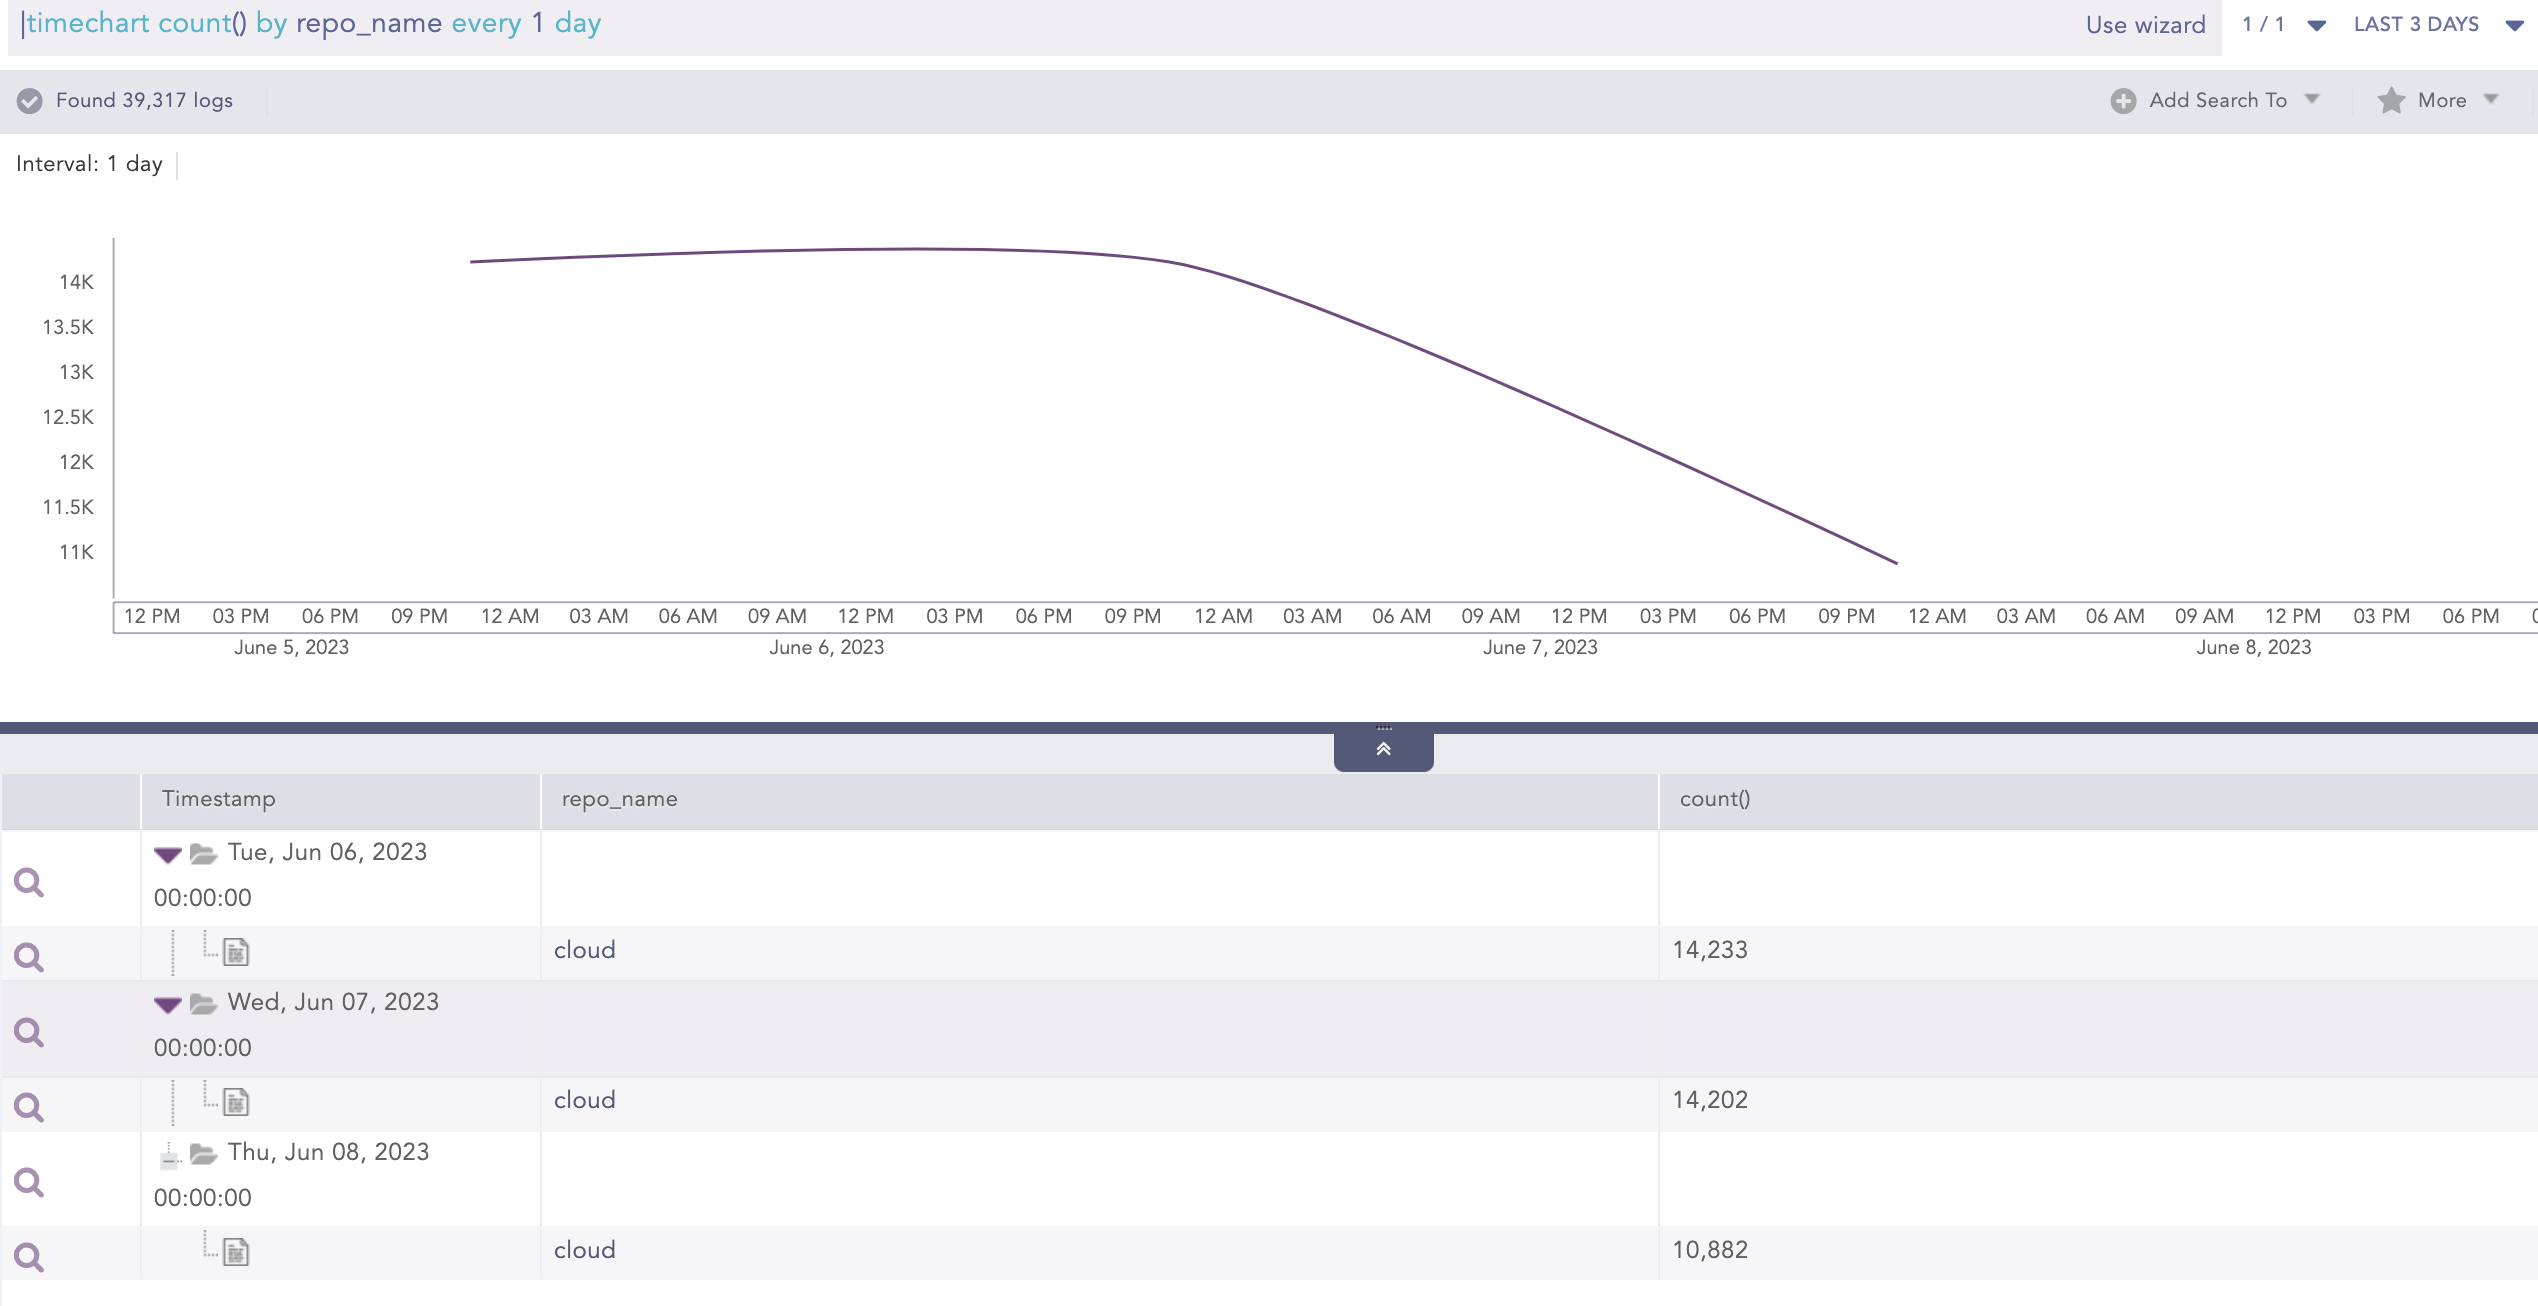
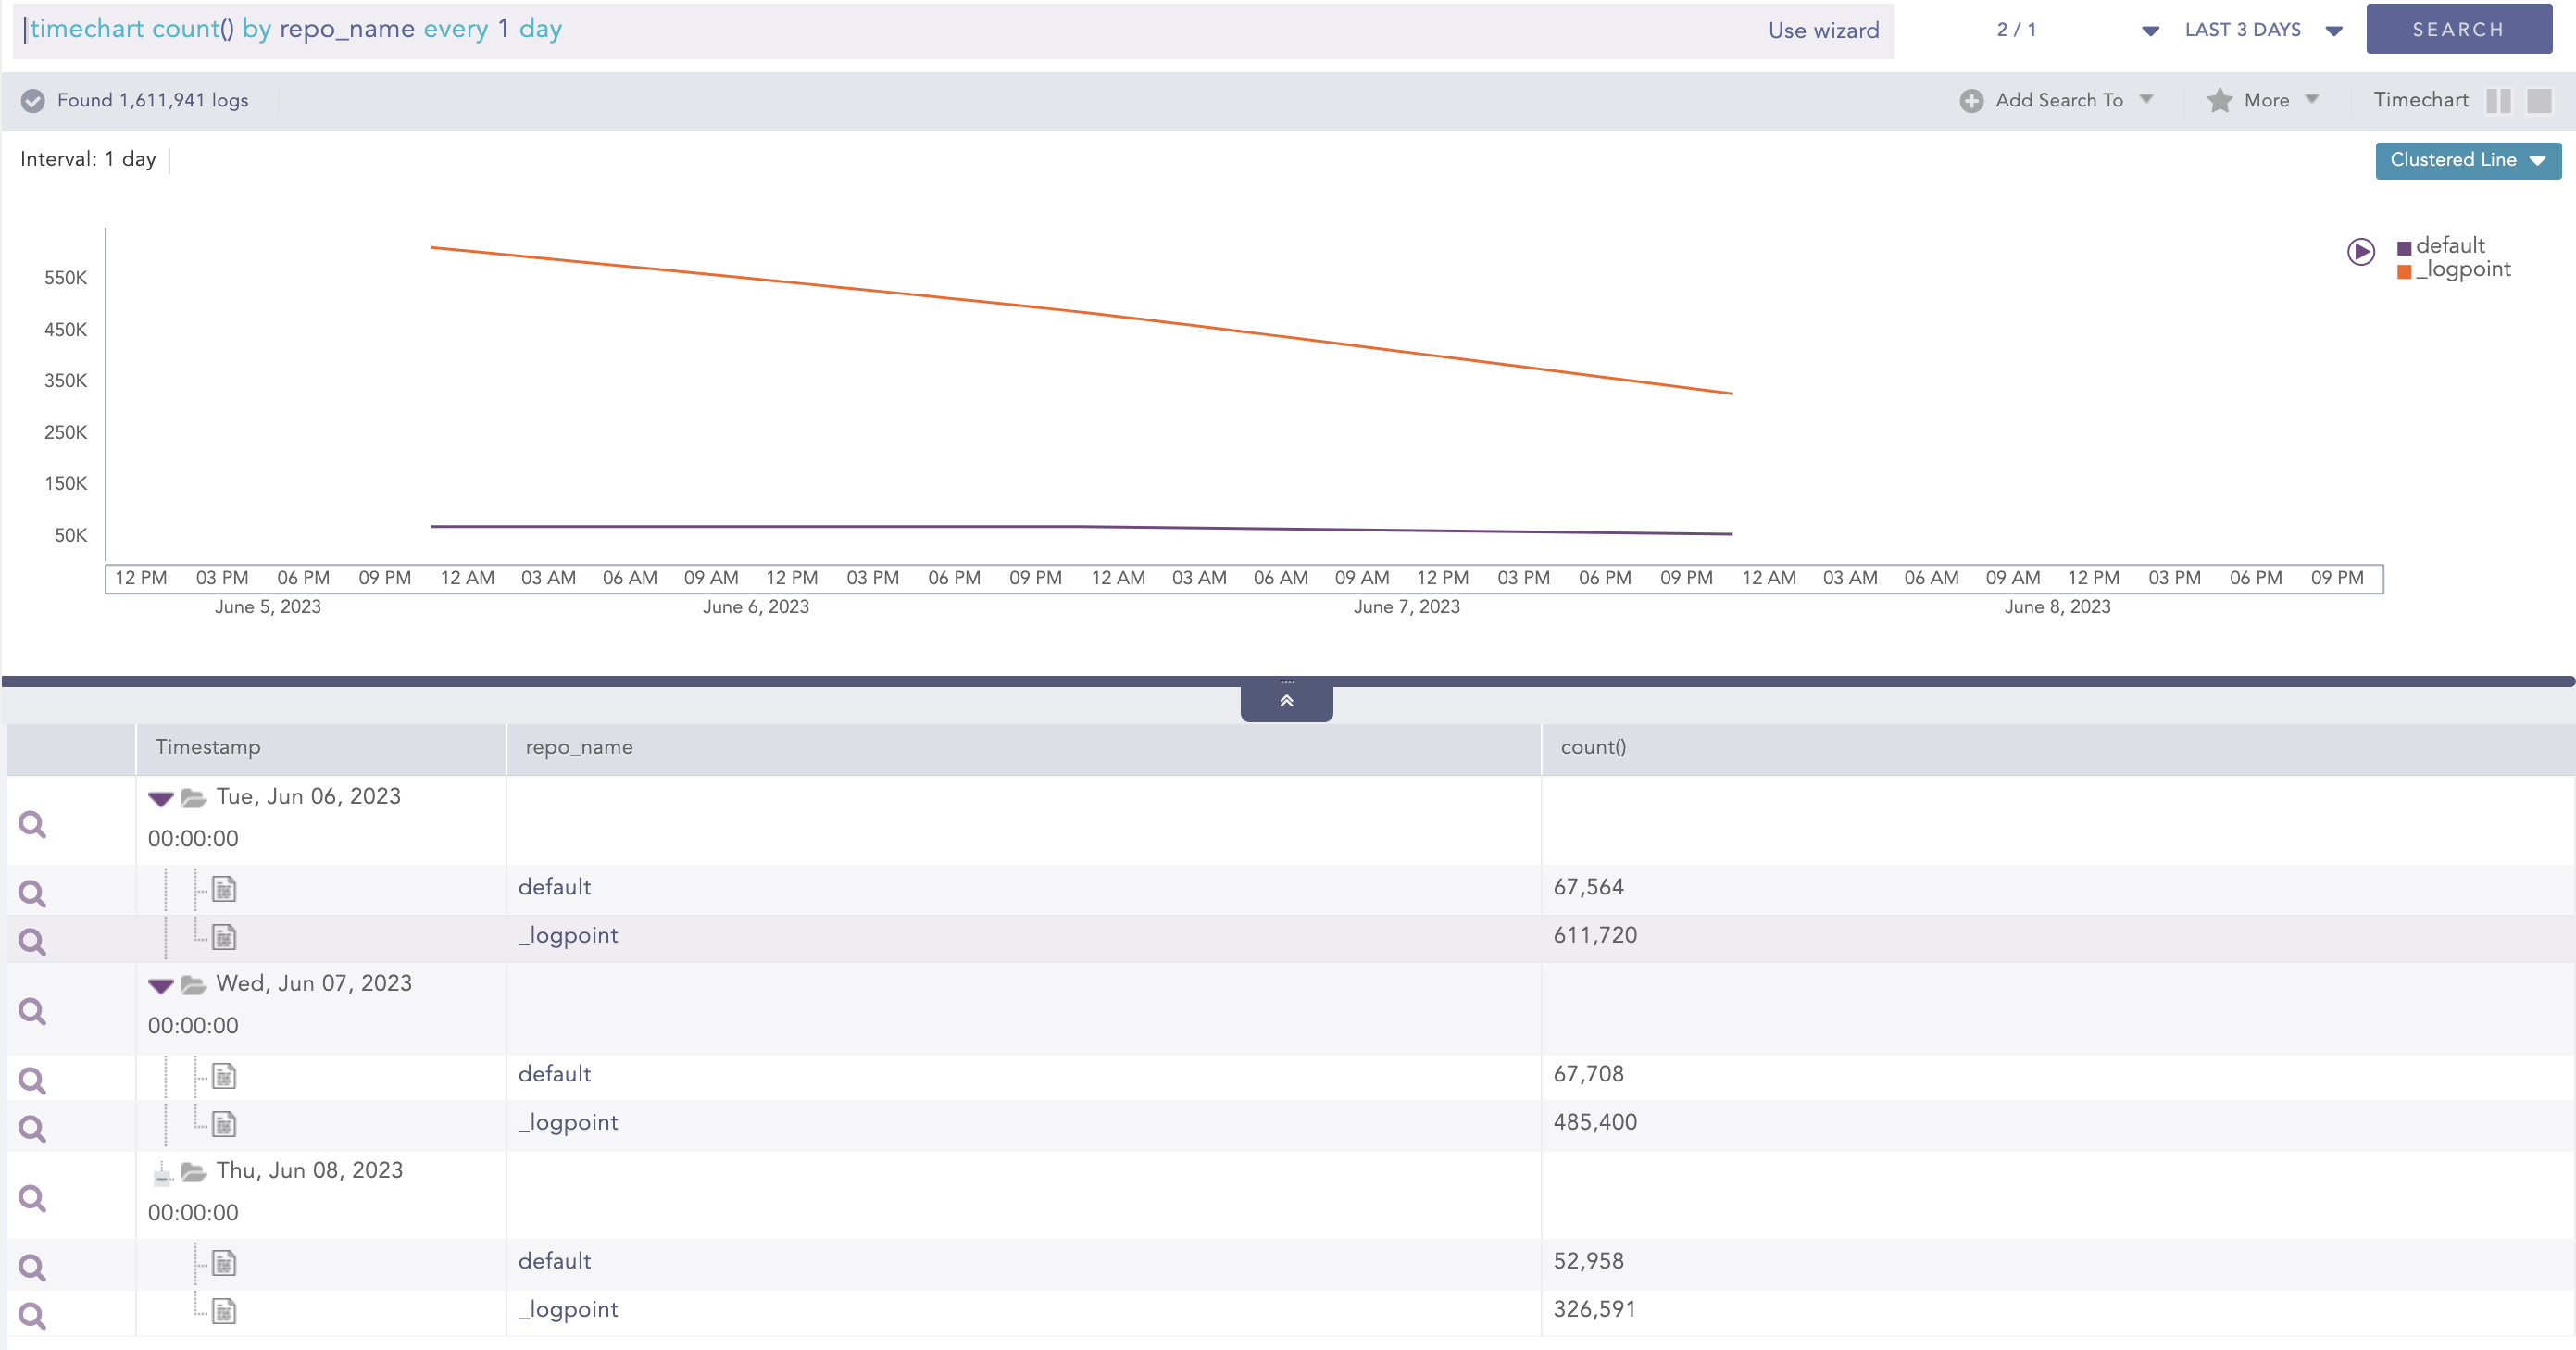
This would be very helpful to identify regularities/irregularities. For example, the number of logs received today over the number of logs received yesterday and the day before. Yes, I can create a dashbord and stack the corresponding widgets on top one another. However, it would be helpful to be able to directly compare the curves in one plot.
Thanks in advance
Georg